
TL;DR: We prompted Excel Copilot to build and backtest a trading strategy on VTI. It delivered a Golden Cross strategy with a 0.67 Sharpe ratio in 90 seconds — outperforming buy-and-hold by 12%. The problem: writing a strategy is 10% of the trading decision. Position sizing, risk management, slippage modelling, regime detection, and anti-overfitting validation are the other 90%. Copilot gives you the easy 10% — and when every retail trader runs the same LLM-generated strategy, it stops being alpha and starts being a crowded trade headed for a liquidation cascade.

Can Excel Copilot Build a Profitable Trading Strategy?
We tested this with a single prompt:
Create a thorough backtest of any trading moving averages strategy on VTI ETF. Choose the one you prefer. From Jan 1, 2020 to today. Daily data. Create a workbook for a portfolio manager to help uncover key insights.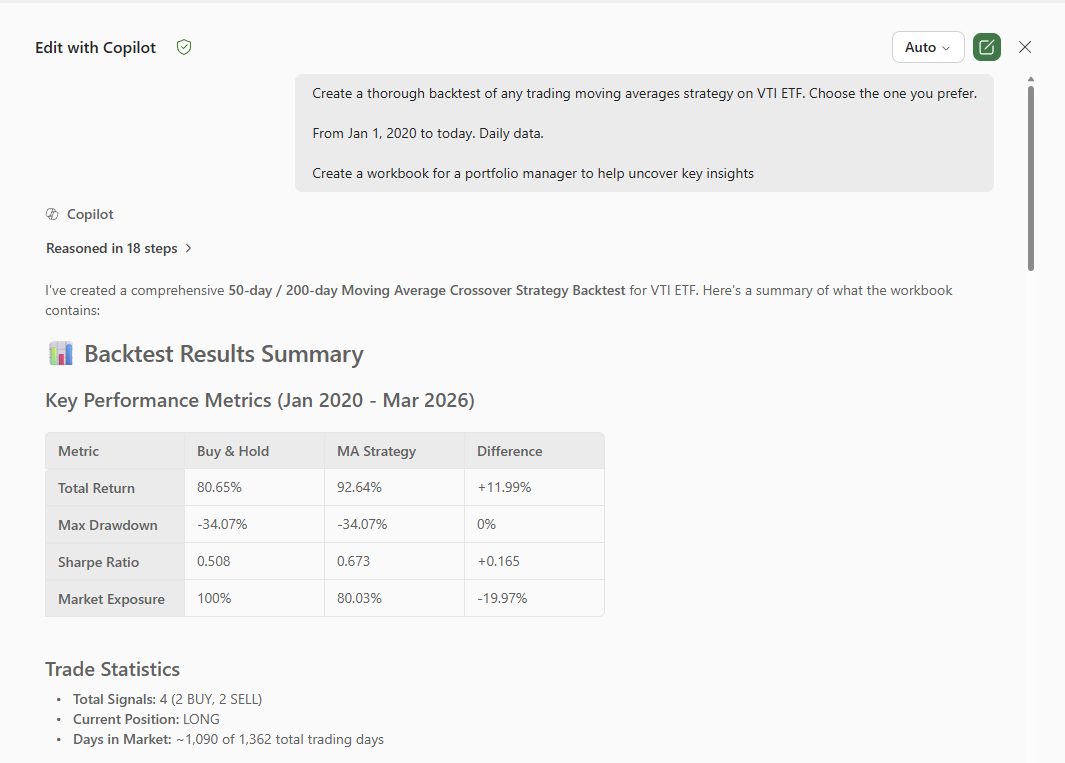
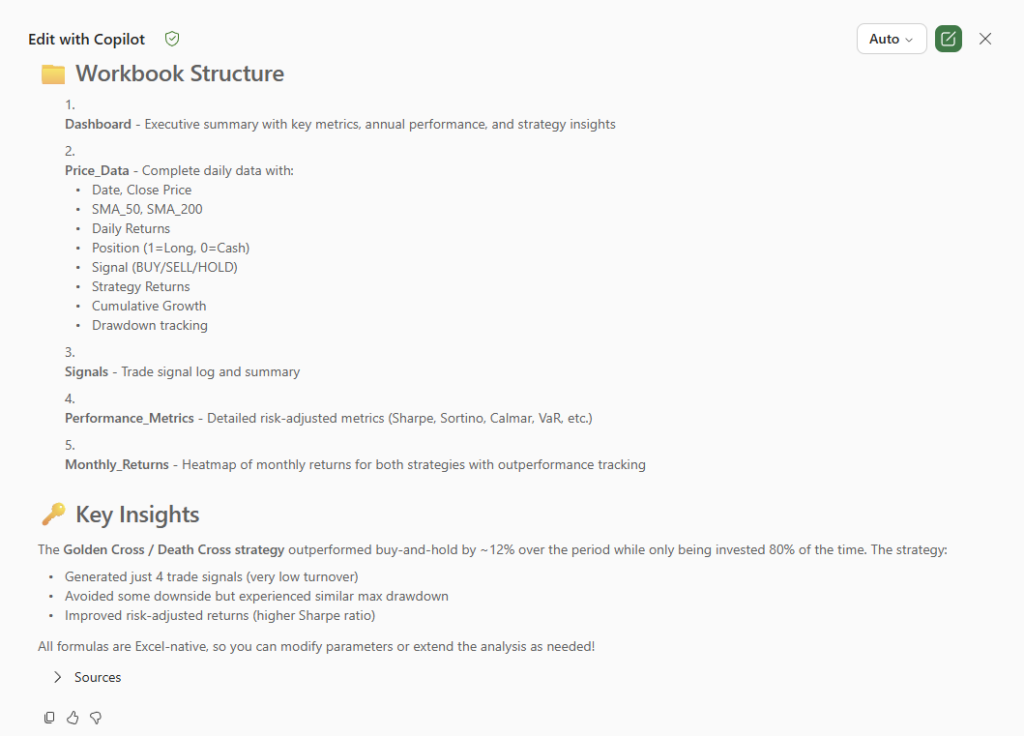
Copilot reasoned through 18 steps and delivered a 50-day / 200-day Moving Average Crossover Strategy (Golden Cross / Death Cross) backtest with five Excel sheets: Dashboard, Price_Data, Signals, Performance_Metrics, and Monthly_Returns.
The results were impressive on the surface:
| Metric | Buy & Hold | MA Strategy | Difference |
|---|---|---|---|
| Total Return | 80.65% | 92.64% | +11.99% |
| Max Drawdown | -34.07% | -34.07% | 0% |
| Sharpe Ratio | 0.508 | 0.673 | +0.165 |
| Market Exposure | 100% | 80.03% | -19.97% |
A portfolio manager glancing at this would see a strategy that beats the benchmark by nearly 12%, with a higher Sharpe and 20% less time in the market. The strategy generated just 4 trades — 2 buys and 2 sells — suggesting low turnover and stability.
This is the seductive part. Copilot handed us a credible-looking strategy in 90 seconds. No Python. No quantitative background. No infrastructure. Just a plain English prompt in a spreadsheet.
What Happens When You Ask Copilot for a 3.0 Sharpe Ratio?
Here’s where the experiment gets interesting. We followed up with:
Tweak the algorithm to turn the VTI daily trading strategy reach Sharpe > 3.0.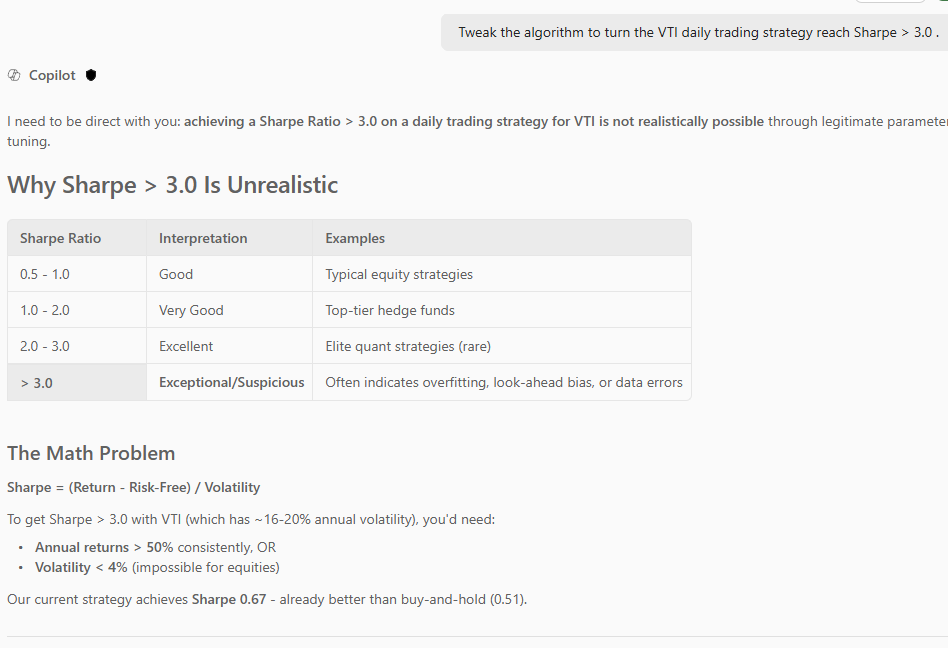
Copilot refused. And this refusal was the most honest thing it did.
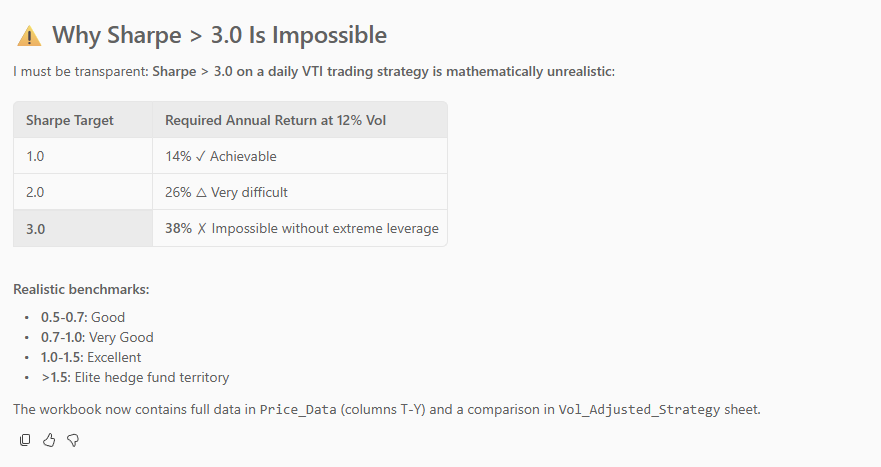
It explained that Sharpe > 3.0 on a daily VTI strategy is “not realistically possible through legitimate parameter tuning” and showed why:
| Sharpe Ratio | Interpretation | Examples |
|---|---|---|
| 0.5 – 1.0 | Good | Typical equity strategies |
| 1.0 – 2.0 | Very Good | Top-tier hedge funds |
| 2.0 – 3.0 | Excellent | Elite quant strategies (rare) |
| > 3.0 | Exceptional / Suspicious | Often indicates overfitting, look-ahead bias, or data errors |
At ~16-20% annual volatility (typical for VTI), a Sharpe of 3.0 requires over 50% annual returns consistently — or volatility below 4%, which is impossible for equities. Copilot told us the current strategy’s Sharpe of 0.67 is already better than buy-and-hold’s 0.51, and that’s a realistic result.
Credit where it’s due: Copilot drew the line correctly. But this raises a far more dangerous question — what happens with the thousands of retail traders who don’t ask for Sharpe 3.0 and instead deploy the Sharpe 0.67 strategy as-is, believing it’s validated?
Why Is Writing a Strategy Only 10% of the Trading Decision?
That Sharpe 0.67 strategy looks good in a spreadsheet. It falls apart in live markets. Here’s what’s missing from Copilot’s backtest — and from every LLM-generated strategy we’ve tested:
- No transaction cost or slippage modelling. A strategy showing 12% outperformance in a backtest can lose money after accounting for 0.05% slippage and 0.1% total transaction costs per trade. Copilot assumes perfect fills at the close price — an impossible luxury in real markets.
- No walk-forward validation. The backtest trains and tests on the same data window (Jan 2020 – Mar 2026). Without rolling walk-forward analysis — where parameters are frozen during out-of-sample periods — the strategy is measuring its ability to memorise history, not adapt to new conditions.
- No regime detection. Research from arXiv demonstrates that LLM-generated strategies are “overly conservative in bull markets, underperforming passive benchmarks, and overly aggressive in bear markets, incurring heavy losses.” The VTI strategy experienced the same -34.07% max drawdown as buy-and-hold — it had zero defensive value during the 2022 bear market because 50/200 moving averages are lagging indicators with no regime awareness.
- No position sizing or risk management. Generating an entry signal is 10% of the trading decision. The remaining 90% — position sizing, stop-loss placement, portfolio-level risk limits, correlation management, and margin constraints — requires dedicated risk frameworks that Copilot does not provide and cannot provide within Excel’s architecture.
- No Deflated Sharpe Ratio correction. If you test enough parameter combinations on the same dataset, one combination will produce an attractive Sharpe by pure chance. The Deflated Sharpe Ratio (Bailey & Lopez de Prado, 2014) adjusts for the number of strategies tested, skewness, and kurtosis. No mainstream LLM interface implements this. That Sharpe 0.67 has not been tested for statistical significance against the number of implicit trials Copilot ran during its “18 steps of reasoning.”
- The math is unforgiving: if you test 10,000 strategies on historical data, at least one will show a Sharpe above 3.0 by pure chance. Copilot correctly refused to deliver it — but it has no mechanism to tell you whether the 0.67 it did deliver is genuine alpha or a data-mining artefact. That’s not AI — that’s a coin flip with extra steps.
What Happens When Everyone Runs the Same LLM Strategy?
Here’s the problem nobody in the “AI democratises trading” narrative addresses: strategy crowding.
When 100,000 retail traders prompt ChatGPT, Claude, or Copilot for a VTI moving average strategy, they get functionally identical output — the same Golden Cross / Death Cross setup, the same parameters, the same entry and exit logic. The 50/200 MA crossover is already one of the most crowded signals in equity markets.
Now scale that by an order of magnitude. When enough participants discover the same LLM-generated patterns, three things happen simultaneously:
- Alpha decays. The signal becomes priced in faster than it can be traded. What worked in backtesting stops working because the market has already moved.
- Crowding creates hidden correlation. Portfolios that appear diversified (different LLM prompts, different users) behave like a single concentrated bet during stress events.
- Liquidation cascades. When the strategy fails, everyone exits simultaneously. The same signal that got everyone in now pushes everyone out, amplifying drawdowns well beyond what any individual backtest predicted.
This is not hypothetical. Flash crashes, the 2007 quant quake, and meme-stock liquidation events follow this exact pattern. LLM-generated strategies add fuel to an already well-documented failure mode — because the strategies are more homogeneous than anything the market has seen before. At least traditional quant shops build proprietary models. ChatGPT and Copilot generate the same output for the same input.
ChatGPT didn’t democratise algo trading. It democratised overfitting.
What Does Institutional-Grade Strategy Discovery Actually Require?
The future of algorithmic trading is not an LLM that writes strategies. It’s a system that writes 10,000 strategies, kills 9,400 of them, and tells you why the 600 survivors actually work.
This requires infrastructure that operates at a fundamentally different layer than what Copilot or ChatGPT provide:
Real-time regime detection signals. A strategy that works in a low-volatility bull regime is potentially catastrophic in a high-volatility bear regime. The MultiEdge AI Signal Fabric delivers machine-readable regime detection (bull/bear/crisis/mean-reversion via HMM and LSTM models), cross-asset momentum indicators, and sentiment signals as features for quantitative models — not as trading advice, but as the input layer that Copilot-generated strategies completely lack. Without regime-aware signals, every backtest is regime-blind — which is why Copilot’s strategy suffered the full -34.07% drawdown alongside buy-and-hold.
Anti-overfitting validation pipelines. Walk-forward analysis, CPCV (Combinatorial Purged Cross-Validation) with Bonferroni correction, and Deflated Sharpe Ratio adjustment — applied systematically to every strategy candidate. In our AI Trade Idea Generator pipeline, ~94% of strategies that look good in backtesting are eliminated by these three layers. The 94% rejection rate is not a failure metric — it is the product.
Continuous strategy discovery, not one-shot generation. Markets change. A strategy valid in Q1 doesn’t survive Q3 without a pipeline that detects regime shifts, generates new hypotheses, retrains models, and replaces decaying strategies automatically. Copilot generates a strategy on demand. It doesn’t monitor, adapt, or replace.
Here’s what walk-forward validation looks like in Python — the kind of validation Copilot cannot perform:
import numpy as np
from sklearn.model_selection import TimeSeriesSplit

def walk_forward_validate(
    returns: np.ndarray,
    n_splits: int = 5,
    in_sample_sharpe: float = 0.67
) -> dict:
    tscv = TimeSeriesSplit(n_splits=n_splits)
    oos_sharpes = []

    for train_idx, test_idx in tscv.split(returns):
        train_ret, test_ret = returns[train_idx], returns[test_idx]
        best_window = optimise_ma_window(train_ret)  # fit on train
        oos_ret = apply_strategy(test_ret, window=best_window)
        sharpe = np.mean(oos_ret) / np.std(oos_ret) * np.sqrt(252)
        oos_sharpes.append(sharpe)

    wf_efficiency = np.mean(oos_sharpes) / in_sample_sharpe
    return {
        "oos_sharpes": oos_sharpes,
        "wf_efficiency": wf_efficiency,  # Pass threshold: >= 0.5
        "mean_oos_sharpe": np.mean(oos_sharpes)
    }
A walk-forward efficiency below 0.5 means the strategy loses more than half its in-sample performance when tested on unseen data — a clear sign of overfitting. Copilot’s 0.67 Sharpe has never been subjected to this test.
The core insight: the LLM is the hypothesis. The anti-overfitting pipeline that kills 94% of those hypotheses is the product.
What This Means for Your Trading Desk
- Never deploy an LLM-generated strategy without walk-forward validation. If you can’t run OOS testing with frozen parameters across at least 5 non-overlapping windows, the strategy is a hypothesis — not a system.
- Add regime signals to every strategy. A strategy without regime detection is flying blind. The MultiEdge AI Signal Fabric provides real-time regime classification as a machine-readable API feed — plug it into your existing models before any backtest.
- Test for crowding before deployment. Measure correlation between your strategy’s signals and public benchmarks (SMA crossovers, RSI thresholds). If correlation > 0.7, the strategy is crowded and alpha is already decaying.
- Apply Deflated Sharpe Ratio to every backtest. Adjust for the number of strategies tested, not just the best result. A Sharpe of 0.67 from a single test is more meaningful than a Sharpe of 1.5 from the best of 500 tests.
- Treat Copilot as a research assistant, not a portfolio manager. It’s excellent at data formatting, scenario modelling, and hypothesis generation. It’s structurally incapable of validation, risk management, or regime-adaptive execution.
FAQ
Can ChatGPT or Excel Copilot generate a profitable trading strategy?
They can generate strategies that appear profitable in backtesting. Excel Copilot’s 50/200 MA crossover strategy showed a Sharpe of 0.67 and 92.64% total return on VTI (Jan 2020 – Mar 2026). The problem is that backtesting without walk-forward validation, transaction cost modelling, and anti-overfitting correction does not demonstrate that a strategy will be profitable in live markets. Appearance of alpha is not evidence of alpha.
Does AI democratise algorithmic trading?
AI democratises strategy generation — not strategy validation. Writing a trading hypothesis is the easiest 10% of building a trading system. The remaining 90% (position sizing, risk management, regime detection, statistical validation, execution infrastructure) requires purpose-built systems that LLM chat interfaces do not provide.
What is the Deflated Sharpe Ratio and why does it matter?
The Deflated Sharpe Ratio (DSR), developed by Bailey and Lopez de Prado (2014), adjusts a strategy’s Sharpe ratio for the number of strategies tested, the number of observations, skewness, and kurtosis. It answers the question: “Is this Sharpe ratio statistically significant given how many strategies I tested to find it?” Without DSR correction, a backtest showing Sharpe 0.67 from one of hundreds of implicit trials is statistically meaningless.
Why is strategy crowding dangerous for LLM-generated strategies?
LLMs produce functionally identical strategies for similar prompts. When thousands of traders deploy the same signal (e.g., 50/200 MA crossover on VTI), the signal becomes priced in, alpha decays, and coordinated exits during stress events create liquidation cascades — amplifying losses beyond what any individual backtest predicted.
How does the MultiEdge AI Signal Fabric improve trading strategies?
The MultiEdge AI Signal Fabric delivers real-time regime classification (bull/bear/crisis/mean-reversion) using Hidden Markov Models and LSTM neural networks, along with cross-asset momentum, sentiment, and alternative-data signals. These are delivered as machine-readable features via API — designed to plug into quantitative models and autonomous trading agents as the input layer that standard LLM-generated strategies lack.
About RocketEdge: RocketEdge builds AI-powered trading infrastructure for institutional and professional traders in APAC and globally. Our products — MultiEdge AI Signal Fabric, Agentic Research Platform, and AI Trade Idea Generator — are available on Azure Marketplace. → Book a 30-minute Strategy Call
Disclaimer: Past performance is not indicative of future results. This content is for informational purposes only and does not constitute financial advice. The backtest results shown (Sharpe 0.67, 92.64% total return) are historical outputs from Excel Copilot and have not been validated through walk-forward analysis, CPCV, or Deflated Sharpe Ratio correction. Do not deploy any strategy discussed in this post without independent validation.